Submission results of annual performance statements 2016–17
An annual performance statement (APS) was completed by 634 licence holders to report on their environmental performance.
The percentage of APSs received by the submission due date increased from 97.5 per cent for 2015-2016 to 98.8 per cent for 2016-17. This is an improvement on the previous year’s submission rate illustrating that businesses are continuing to take their environmental reporting responsibilities seriously. The improvement was also driven by sending timely reminder emails to licence holders. Continuing the upward trend from last year, around 63 per cent of all licence holders reported full compliance with all licence conditions.
Table 1 displays a comparison of submission and average compliance rates for the single-site licences and amalgamated licences (a licence with a combination of two or more single site licences for the same legal entity).
Table 1: Percentage of submission and average compliance for the two different licence types
| Licence type |
No. of licences |
Submitted on time (%) |
Average compliance (%) |
| Single site |
367 |
97.6 |
93.8 |
| Amalgamated |
43* |
100 |
95.9 |
* Consists of 267 premises
Please refer to Figure 1 for comparison of average compliance rates as reported by the licence holders on their APS for the various sectors.

Figure 1: Percentage of compliance for different scheduled categories for FY 2016-17 APS
There is a 24 per cent increase from last year’s high average compliance rate of above 91 per cent for the landfill sector. For 2016-2017, the lowest performing sector was non-metallic minerals decreasing from 71 per cent in 2015-2016 to 57 per cent.
The highest performing sector is utilities, which increased by 3 per cent from 2015-2016 submission period.
Enforcement
Two licence holders submitted their APS past the due date of 2 October 2017. These two sites have been issued with Official Warnings in accordance with EPA’s Compliance and Enforcement Policy.
Audit results of annual performance statements 2016–17
Ten APS audits were conducted in 2017–18 to assess submissions for the financial year 2016–17. Of the ten audits conducted, three were from the prescribed industrial waste (PIW) management sector, two were from the food processing sector and the other five premises audited were licensed to discharge to air or water.
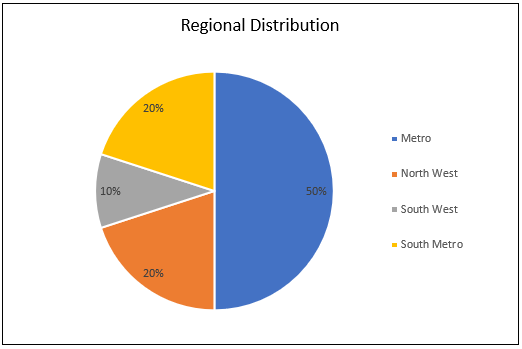
During this audit period, 50% of the premises audited were in the Metropolitan region (Metro), followed by 20% premises in the North West and Southern Metropolitan regions (South Metro) and 10% in the South West region. Higher numbers of audited premises for Metro, South-Metro and South West reflect the number of licensed premises and the risks they pose in these regions. See the figure below for the regional distribution of premises audited for 2016–17 APSs.

Figure: Regional distribution of APS audits
Audit outcome
Most sites audited had issues with their monitoring program. For example, for premises that are allowed to discharge to air or water, 65% of the total compliance advice provided was to address minor gaps in the monitoring program.
EPA also issued four pollution abatement notices (PANs) during this audit period for not having an adequate monitoring program in place. All four licence holders declared “yes” in their APS submission.
Other licence conditions for which compliance advice was provided relate to not having adequate procedures, or not reporting to EPA in the event of a pollution incident. This trend was observed for all premises audited.
EPA provides compliance advice where minor issues are identified. In those cases where significant issues are identified, PANs are issued.